


According to Sprout Social, a whopping 65% of B2B marketers use infographics.
No surprise! Infographics increase engagement, make it easier to digest and retain information, and are more likely to be shared than text-only content.
And they attract links!
In this comprehensive guide to infographic link-building, you will learn how to create amazing infographics for your link-building campaigns and how to promote them for maximum impact.
But before this, we cover some basics:
- How infographic link-building works
- Why it’s challenging
- What are the different types of infographics
Let’s get started!
Key takeaways
- Infographic link-building is a digital marketing strategy involving creating visually engaging infographics to attract backlinks from other websites.
- Content with visuals attracts significantly more backlinks than text-only content, increases customer engagement, improves user experience, enhances information retention and understanding, and brings referral traffic.
- The main challenges of the strategy include standing out in a crowded field, the cost of original research, and the need for regular updates to maintain relevance.
- Timeline, statistical, comparison, process, geographic, hierarchical, and list infographics are popular infographic types.
- Creation Process:
- Start with a concept (repurpose existing content, competitor analysis, search trends)
- Research data (original or secondary sources)
- Design the infographic (clarity, visual hierarchy, engaging visuals, effective color use)
- Optimize for search (file name, alt text, meta description)
- To promote your infographics, run outreach campaigns and share them on social media.
- Need help with your infographic link-building campaigns? Get in touch with the Editorial Link team.
What Is Infographic Link Building?
Infographic link building is a digital marketing strategy that involves creating visually engaging infographics to attract backlinks from other websites.
Here’s how it works, in a nutshell:
You turn information and data into an infographic and promote it among other content creators, be it bloggers, journalists, or social media users. And they share it with their audiences, for example, by linking to it from their articles.
By doing so, they don’t just pass link juice to your site, improving its SEO performance. They also get it in front of other people that you might not reach otherwise., which increases your online visibility and establishes you as an authority in your niche.
Why Use Infographics For Your Link-Building Campaign
Infographics are proper link magnets.
I’ve seen claims that blog posts with infographics attract 178% more backlinks than articles without them. Although I haven’t been able to verify this figure at the source, I don’t think this figure is massively exaggerated.
And it isn’t because they make them more visually appealing but because they add value to the linking content.
First, they increase customer engagement. Social media posts with visual content get 650% higher engagement than text ones. And readers are 30x more likely to read the entire infographic than an article or blog post.
What’s more, they improve the user experience, which is a ranking factor. About 65% of the world's population are visual learners, and this affects how we consume content. Readers understand text with graphics 323% better and retain the information longer.
More links and more shares mean that articles with infographics attract more traffic to your website. It’s estimated that by 12%.
Is Infographic Link Building Difficult?
Let’s not beat around the bush: infographic link-building is challenging.
Nothing that brings results in SEO, and in life in general, is easy. Otherwise, everybody would be doing it. And this would devalue it as a link-building tactic.
The main hurdles to jump?
- AI and tools like Canva make it easier to create visually appealing infographics but harder to stand out as a result.
- Original, in-depth research is time-consuming and costly.
- Unless you update them regularly, infographics might quickly lose their relevance.
- It takes time for infographics to attract high-quality backlinks organically. To amplify their impact, you still need to promote them, for example, through outreach, which is resource-intensive.
To make it work, you need the right strategy and resources—both financial and human— onboard. This is where specialist link-building agencies like Editorial.Link might have the edge over many in-house teams.
Types of Infographics That You Can Use
What kinds of infographics can you leverage for link building?
Here are 7 top ones.
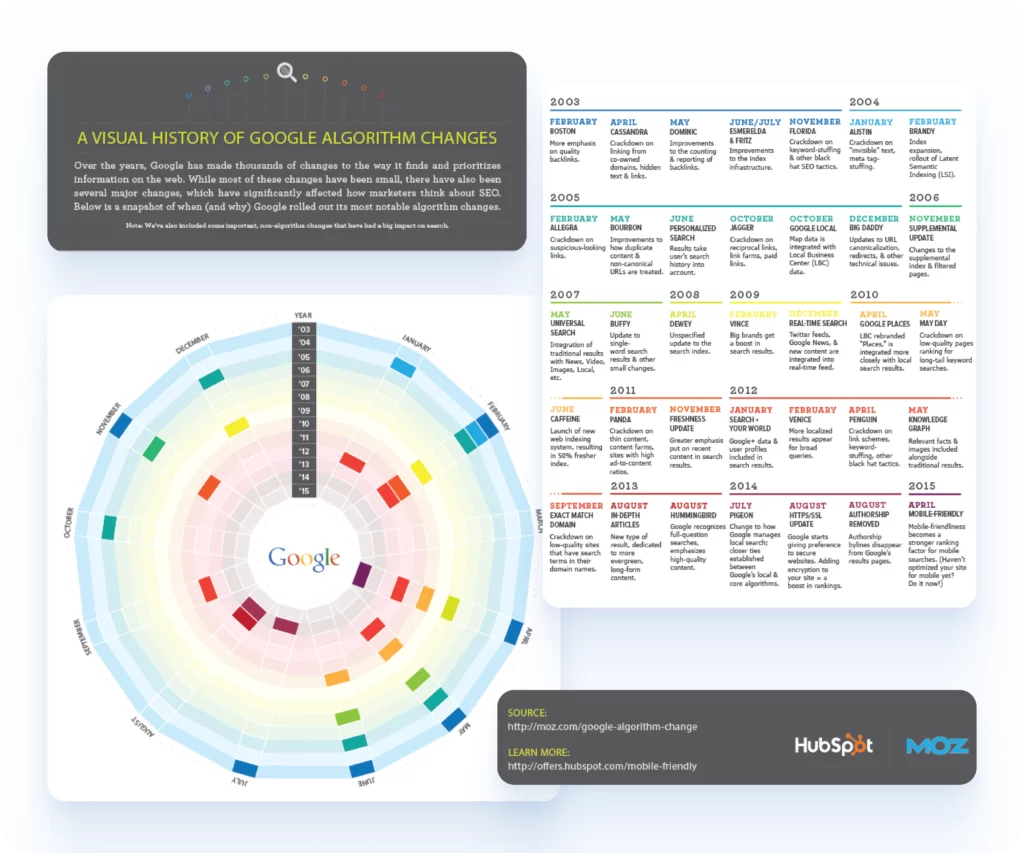
1. Timeline infographics
Timeline infographics visually represent events or data points in chronological order.
They are ideal for showing the history or progression of a topic, project milestones, or the evolution of a concept over time.
Like Google algorithm, as illustrated in this extremely well-researched infographic from Hubspot.
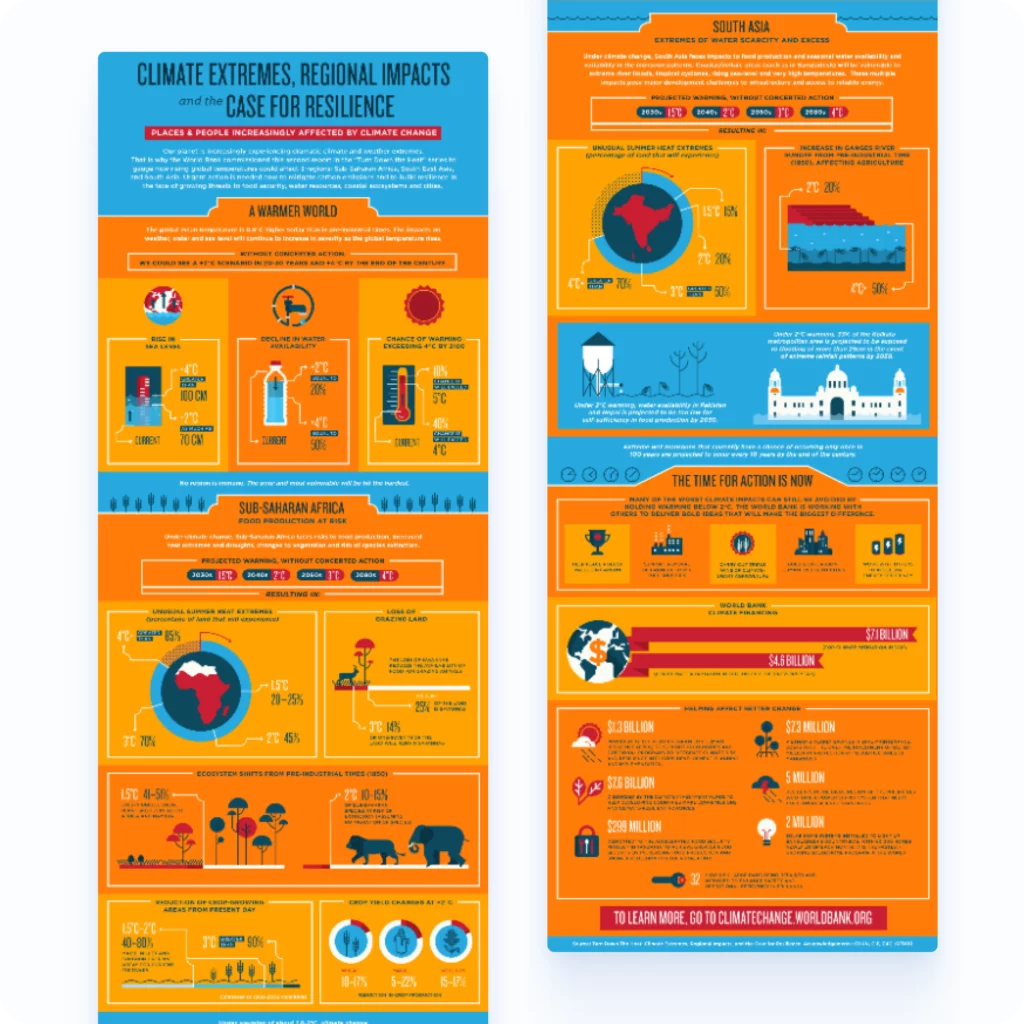
2. Statistical infographics
Statistical infographics use charts, graphs, and other visual elements to present numerical data and statistics in a compelling way.
They are best suited for highlighting research findings, survey results, or industry trends.
Here’s a brilliant example of such a data-packed infographic about the impact of climate change created by the World Bank.
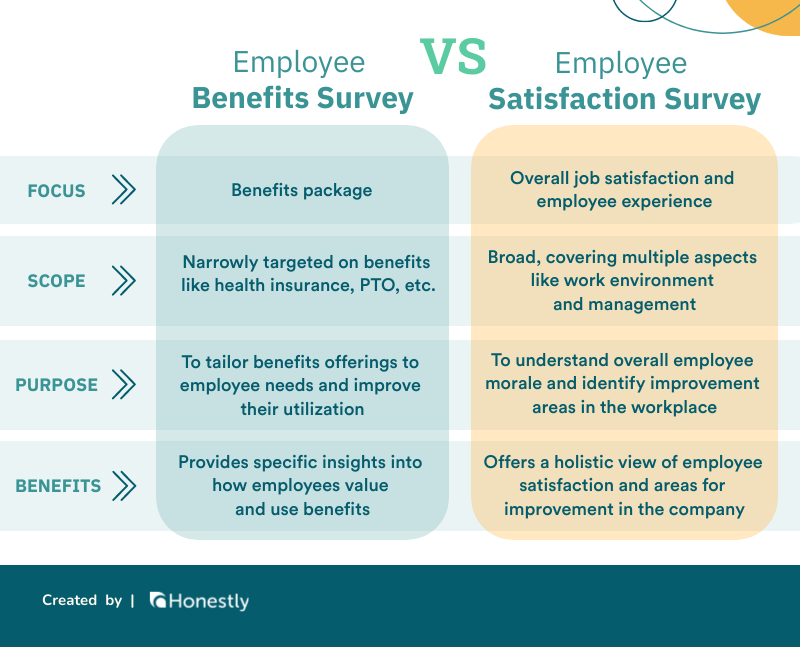
3. Comparison infographics
Comparison infographics juxtapose two or more options side by side, highlighting their similarities and differences.
They help viewers quickly understand the pros and cons of each option, making them ideal for decision-making.
Want to see a good example? Check out this informative infographic from Honestly contrasting Employee Benefits and Employee Satisfaction Surveys.
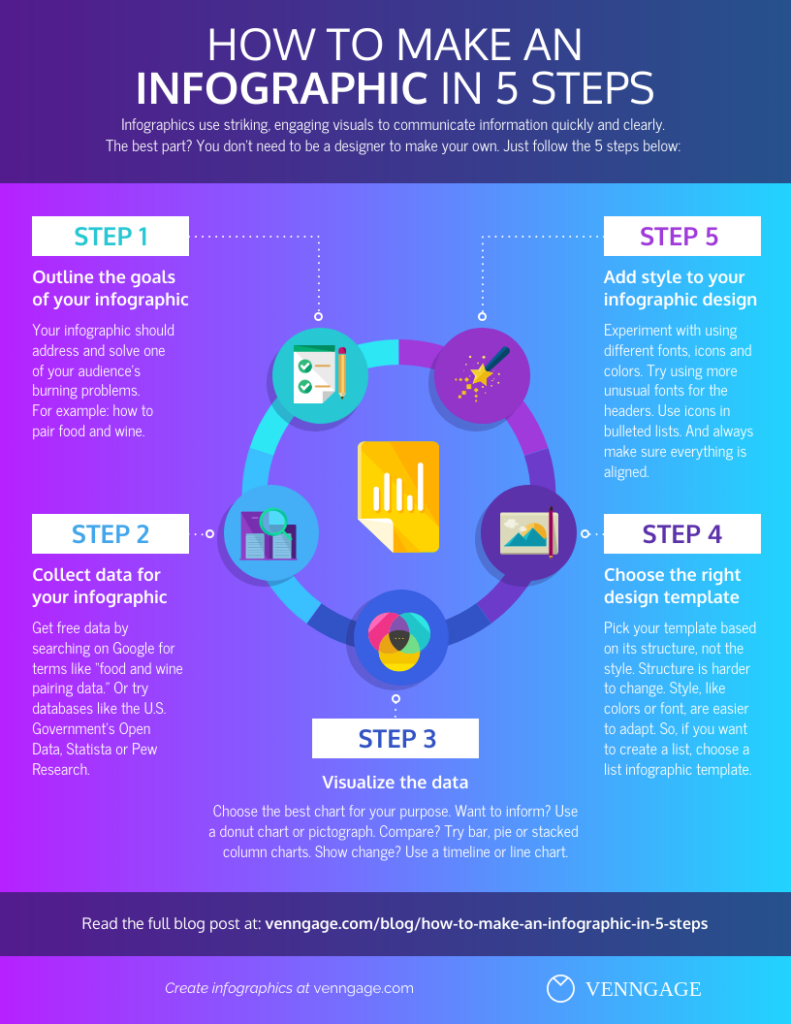
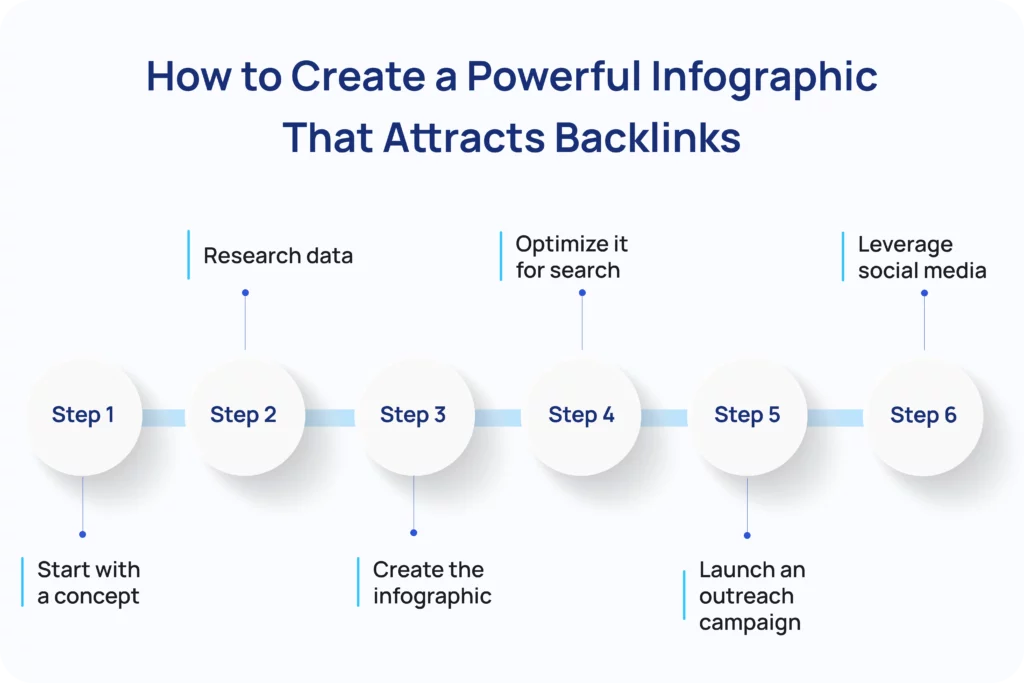
4. Process infographics
Process infographics outline a sequence of steps or stages involved in a particular process.
They simplify complex procedures by presenting them in a clear, step-by-step visual format, making them useful for tutorials and workflows.
Like this compelling infographic by Venngage. Illustrating the infographic design process.
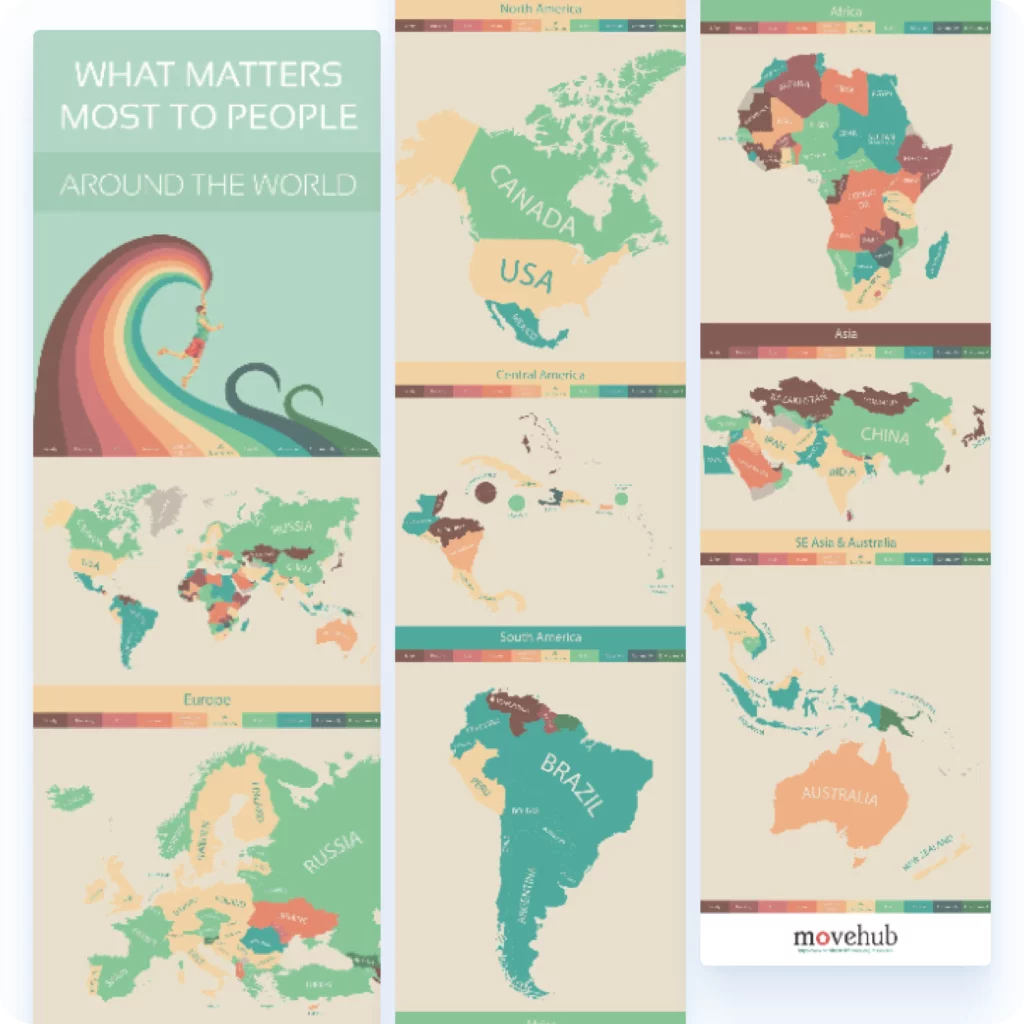
5. Geographic infographics
Geographic infographics use maps and spatial data to illustrate information based on location.
They are effective for displaying demographic data, regional statistics, or geographic comparisons.
Here’s a good example. This original infographic by MoveHub illustrates what people around the world value the most in their lives.
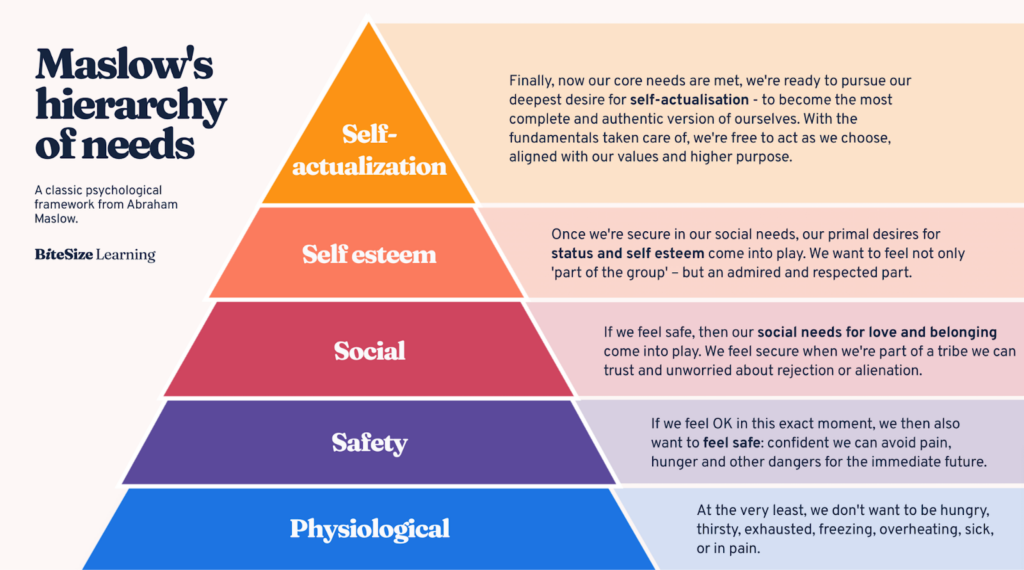
6. Hierarchical infographics
These infographics organize information into levels of importance or rank, often using pyramid or tree-like structures.
They are commonly used to depict organizational charts, rankings, or classification systems.
Here’s a classic: Maslow’s hierarchy of needs created by Bitesize Learning.
7. List infographics
List infographics present information in a list format, often enhanced with icons, images, or other visual elements.
They are perfect for summarizing tips, resources, or critical points in an easy-to-follow format.
Here’s an example of an excellent infographic with tips on how to create SEO content by Visme.
How to Create a Powerful Infographic That Attracts Backlinks
With the theory covered, let’s get down to work and create an infographic that will bring juicy backlinks to your website.
Start with a concept
How do you choose the topic for your infographic?
Here are my favorite tactics.
Repurpose your existing content
If you already have valuable content in your blog, the easiest way to start infographic link-building is by repurposing the content.
For example, you can turn your research studies and stat round-ups into statistical infographics, how-to guides into process infographics, and tool X vs tool Y into comparison ones.
Which blogs should you prioritize?
Start with those that already get traffic and rank in the top 5-20 positions. By enhancing them with high-quality infographics, you can give them the boost they need to climb in SERPs.
Competitor analysis
The easiest way to find infographic topics is to check what kinds of infographics earn links for your competitors.
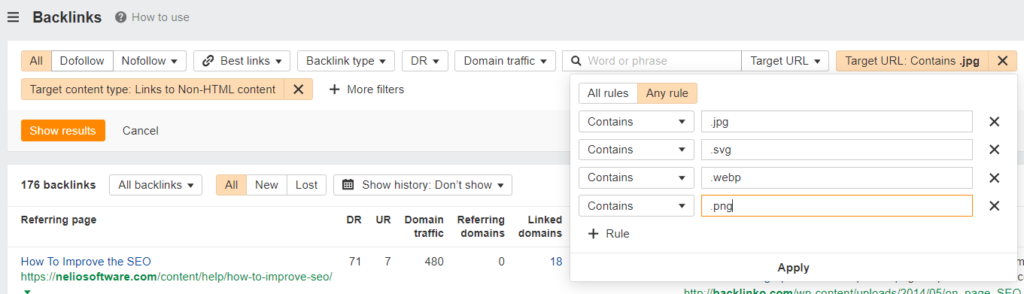
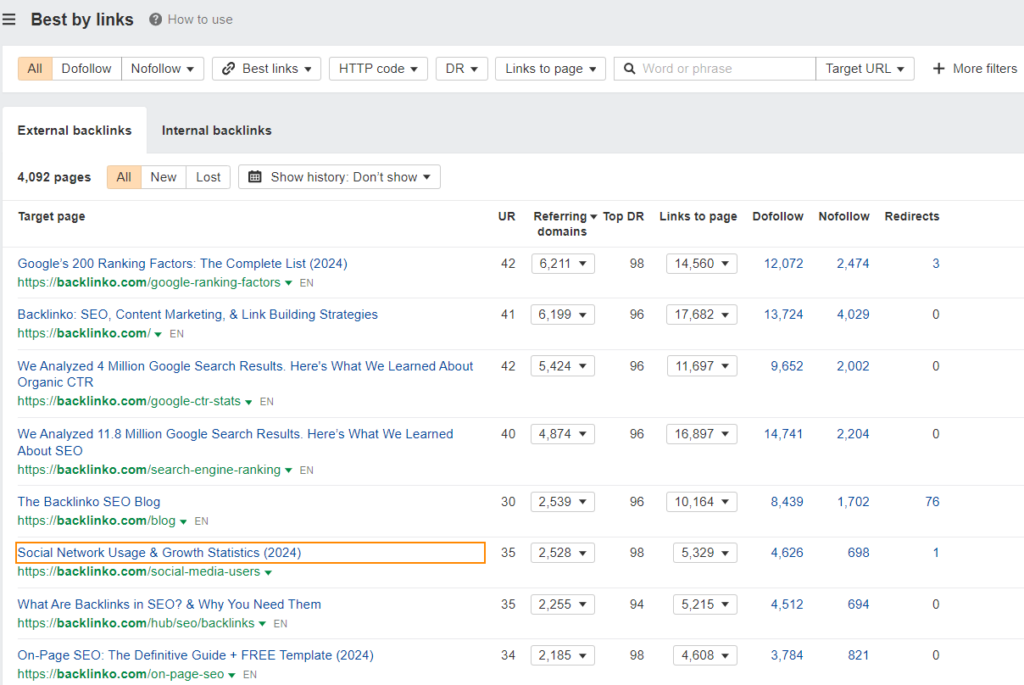
To do so, I use Ahrefs Site Explorer.
In the Backlinks report, I search the results for pages containing .jpg, .svg, .webp, and .png files in the Target URL and filter the results by the Target content type: Links to Non-HTML content.
When eyeballing the results for infographics, look for connections between them. Sometimes, you may be able to combine two or three successful infographics into one. Or flip it and break it down into multiple micrographics.
Mind you, your competitor research doesn’t need to focus on infographics only.
You can also look at the Best by links sites to identify the type of content that attracts the most links and use it as an inspiration for your infographic.
Of course, if the content is based on their original research, you can’t just repurpose it without acknowledgment. However, stat roundups are fair game, especially if you make them more comprehensive and up-to-date.
Search trends
Another way to find a popular topic for your infographic is by investigating search trends. Which you can do with tools like Answer The Public or Exploding Topics.
Imagine you’re looking for infographic ideas in AI.
To pick up the most recent trends, change the timeframe to 3 months and run a search for AI (requires the paid plan).
You will get a list of trending AI-related keywords together with their search volume and growth.
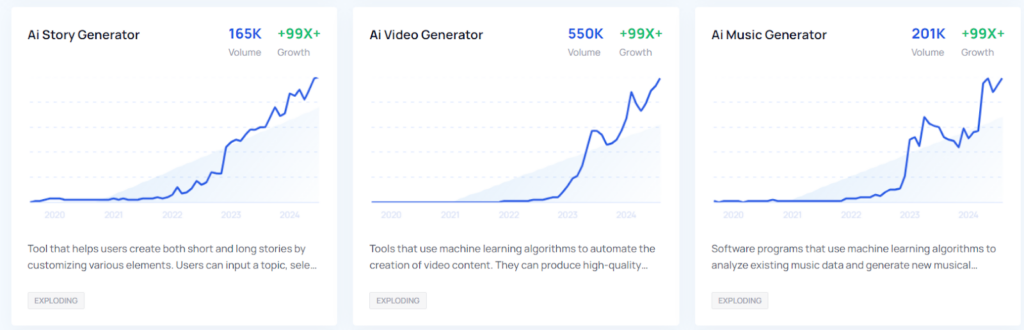
Three possible infographic topics emerge: AI story generator, AI video generator, and AI music generator. For each of them, you could create a list of infographics featuring tools in each category.
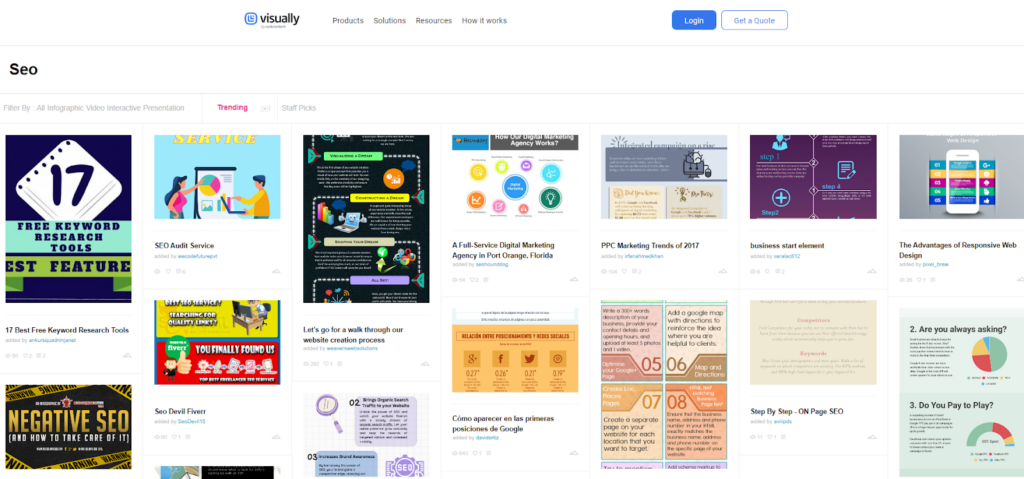
Use infographic directories
Infographic directories like Visual.ly can also be a good source of inspiration.
To find them, copy https://visual.ly/tag/[YOUR NICHE], into your browser.
For example, https://visual.ly/tag/SEO, and order the results by Trending.
Research data
Of course, you will get the most engagement from infographics featuring original data.
But let’s face it: conducting original research is extremely time-consuming. And it costs A LOT.
If you don’t have adequate resources, you can still create quality content by collating data from secondary sources.
Start looking for the most recent roundups on your topic and supplement them with additional data whenever available to give them the edge.
The odds are that writers and bloggers looking for data won’t bother to trace the original source and will link to yours instead.
Create the infographic
With the data in place, it’s time to create the infographic.
It’s best if you have an in-house graphic designer, as they can create a design consistent with your branding.
If not, there are plenty of freelance guns for hire on Fiverr or Upwork, charging $20-30 an hour.
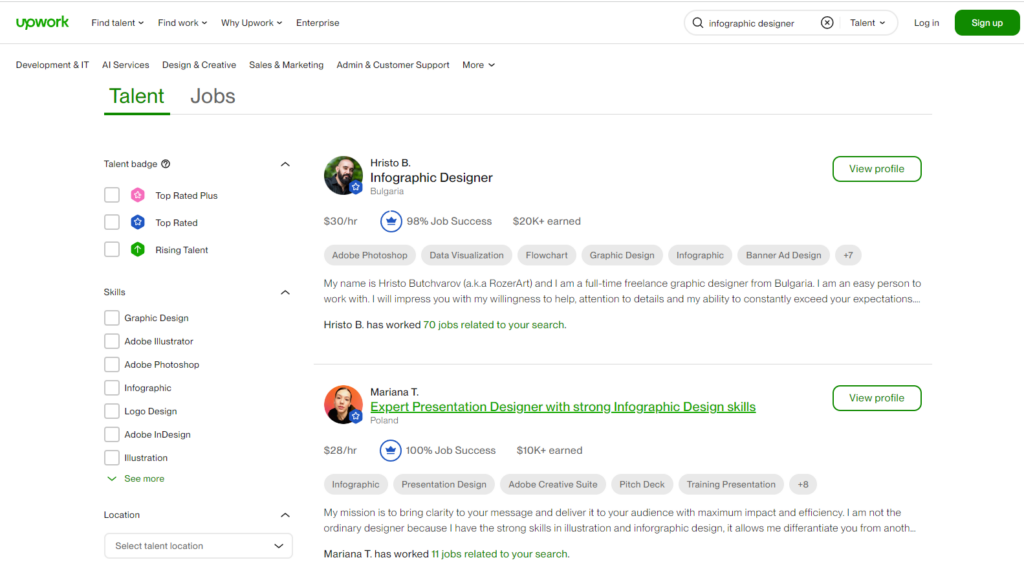
Or if you really have time on your hands and want to get your creative juices flowing, you can give it a bash yourself in Canva.
What makes a good infographic design?
- Clarity and simplicity: Communicate the message clearly with minimal text and straightforward visuals.
- Visual hierarchy: Organize content logically, highlighting key points for easy understanding.
- Engaging visuals: Use compelling graphics and maintain a consistent style throughout.
- Effective use of color: Choose colors that align with the message and ensure readability. For example, use red when covering urgent issues.
Optimize it for search
If your infographic is to earn organic backlinks, make it easy to find via search.
Optimize the image by including the relevant keywords in the file name, for example, "digital-marketing-trends-2024-infographic.png."
Once you insert the image into your article body, add a descriptive alt text that includes the target keyword. For example, "Infographic highlighting key digital marketing trends for 2024, including AI integration and personalized content strategies."
Search engines can’t interpret images so this helps them understand the content of the infographic and improves visibility in image search results.
When Hubspot focused on optimizing alternative texts back in 2018, their image traffic shot up by 779% in less than 12 months!
And they make your content more accessible for users who depend on screen readers.
Of course, don’t forget about other elements of search engine optimization. Like including a keyword-rich title, a meta description, and the image introduction/summary in the body of the text.
My #1 recommendation for this problem is to ‘annotate’ your infographic with descriptive text, alt tags, and meta descriptions, which will help search engines grasp its relevance. This one step can bridge the gap between visual and SEO success, transforming your infographic into a link-building powerhouse.

Chief Editor at Verpex
Launch an outreach campaign
As mentioned, organic link acquisition takes months. If you rely on just that, you won’t get the most out of your infographic.
Solution?
Promote your content via cold outreach.
Find prospects
When looking for prospects, your SEO suite is your best friend.
If you’ve used your competitors’ most linked-to infographics as an inspiration, compile a list of authoritative sites linking to those infographics.
You can do it by plugging the infographics’ URL into Ahrefs Site Explorer and heading to the Backlinks report.
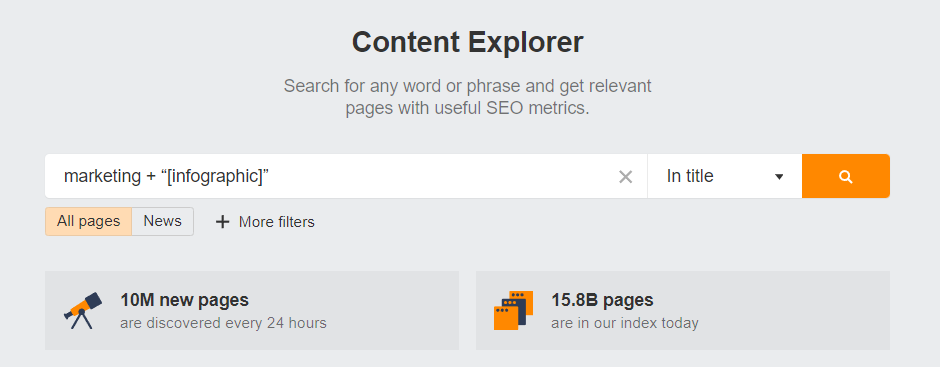
Next, search for articles linked to the topic of your infographic.
Imagine you’ve just created an infographic on different ways to lose weight.
In Content Explorer, search for “lose weight”.
Narrow down the scope to sites that publish infographics by adding + “[infographic]” and changing the search parameter to In title.
Filter the results by language, domain rating (30+), and page traffic (100+).
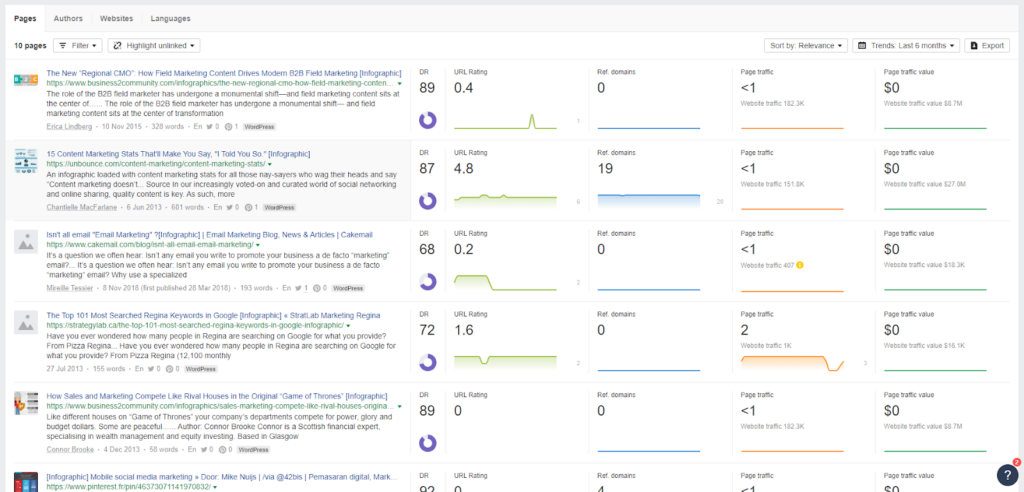
Finally, export the results into a spreadsheet.
Find the contact details
The next step is finding the contact details of the decision-makers with the power to add your infographic to the text.
You can do it manually, by searching out the organizations via LinkedIn and contacting them there. This allows you to warm up your prospects before you pitch the infographic.
But this isn’t the most efficient way to do it.
What is?
Using an outreach tool like Hunter.io.
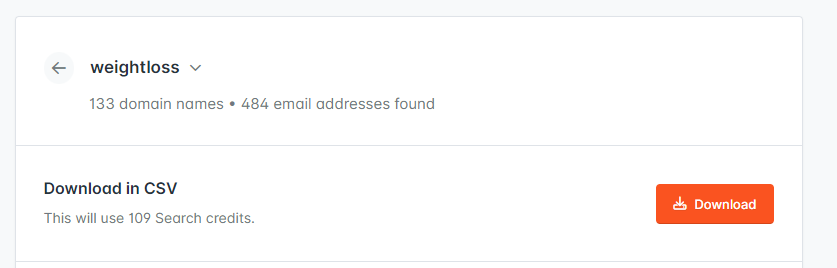
1) When you log into your account, click Bulks in the top menu. Choose Domain Search.
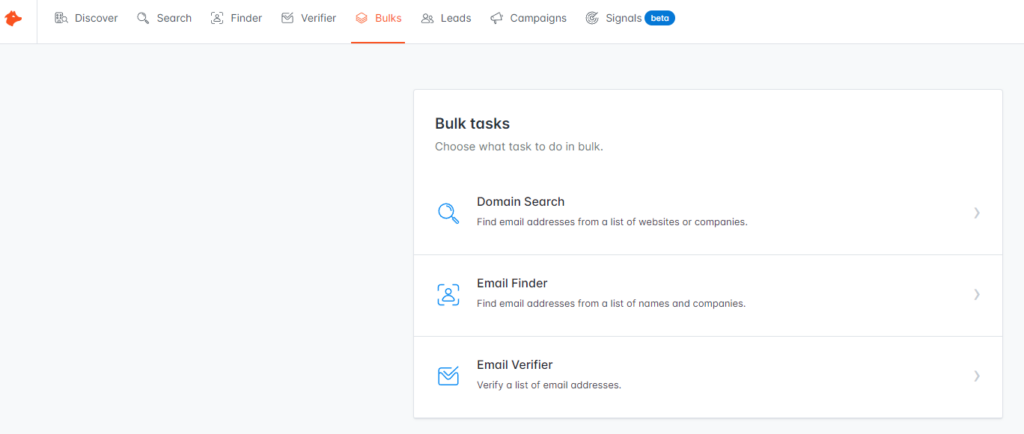
2) Click on the +New bulk button.
3) Upload the spreadsheet you’ve imported from Ahrefs.
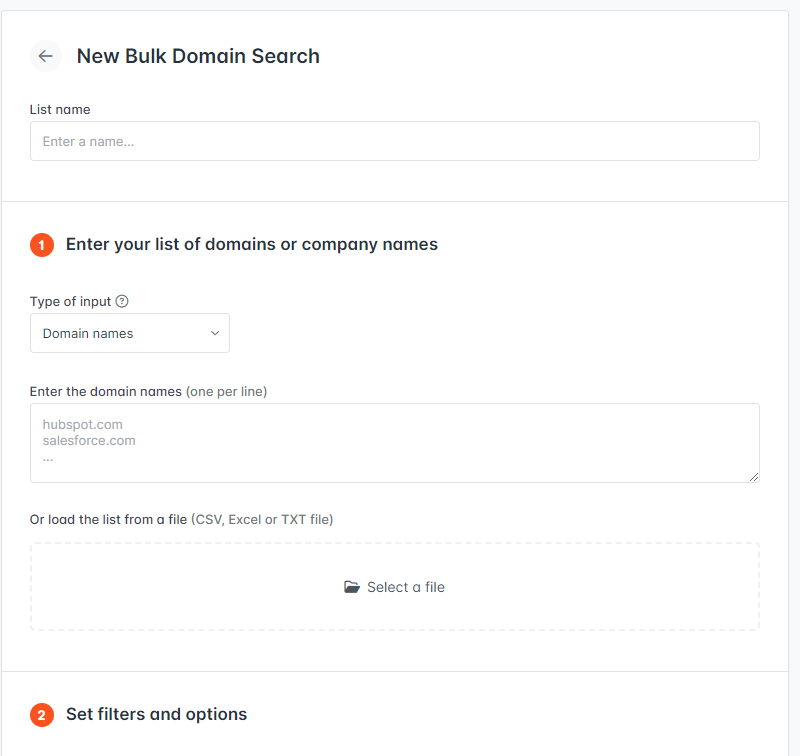
4) Download the list
You can then upload the identified people with their addresses as Leads and use them as the target audience for your campaign.
Create a template
The template you create can make or break your campaign.
SEOs, Marketing Managers, and website owners get dozens if not hundreds of similar emails every week, so there’s a big chance your email will never get a response. Or even get opened.
Here are a few things that can increase your chances, though:
- Craft a compelling subject line. Include a number and make it 30-50 characters or 4-7 words long.
- Personalize the body.
- Get straight to the point.
- Keep it short and sweet. 100 words is all you need.
- Use white space and bullet points to make the email easy to read.
- Clearly spell out the value your infographic brings.
- Include a clickable link to your infographic.
Here’s a sample template you can use:
Follow up
As mentioned, one email may not get you much. So, always follow up.
How many times?
Following up once can increase the response rate by 65%, and Hunter has found that 3 follow-ups bring the best results. That’s when the gains are the largest.
Don’t send follow-ups every day, though! Wait 2-5 days between subsequent emails.
In Hunter.io, you can plan the whole sequence of follow-ups at once.

Leverage social media
In addition to outreach, Taylor Scher, an SEO consultant, recommends promoting your infographics on social media platforms as it increases its reach:
With social, I think you get more reach out of it…. I think the main benefit here is that it’s so easily repurposable. People can easily share it, and if people are sharing it, that’s your sign to add this infographic to your website. If it resonates with people on social, it will probably resonate with others too.

Bonus Tips for Infographic Link Building by Our Team
Sometimes, ideas for brilliant infographics come from your broken link search.
When you find broken links to a page with infographics (and quality links), you can find out what they looked like using the Wayback Machine and recreate them.
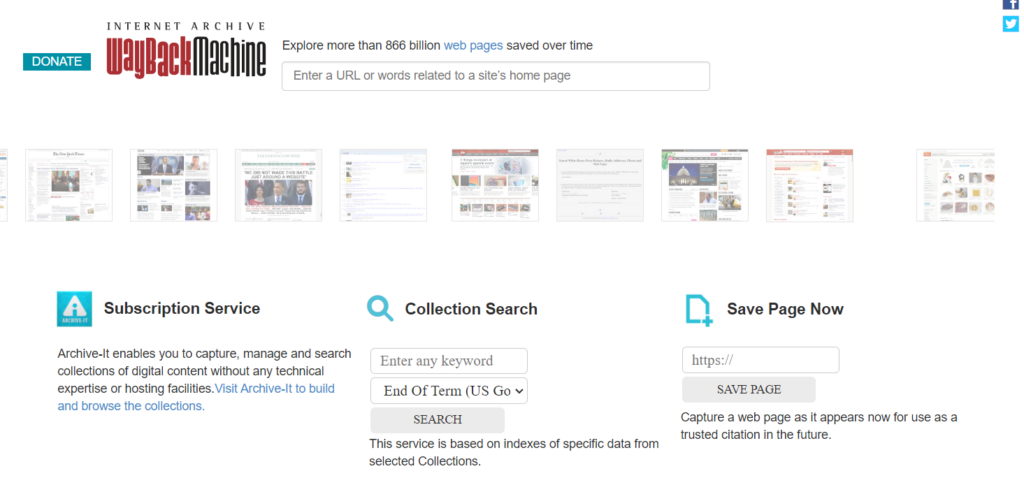
And then acquire backlinks to them.
That’s how we’ve managed to get a few quality links for our clients.
Final Words
Infographics are some of the most popular linkable assets because they pack in a lot of value. They communicate sought-after insights, data, and statistics in an easily digestible and visually attractive way.
However, their link-magnet potential and the availability of tools like Canva mean that everybody is “doing infographics.” This makes it difficult to stand out.
To gain traction, your infographic must be more than just pretty. It needs to offer unique data and present it from an original angle.
Which requires expertise and a comprehensive strategy.
Wondering how to best leverage infographics in your link-building campaigns? Get in touch with the Editorial.Link team.

![11 Creative Ways To Earn Links [in 2024 & beyond]](https://editorial.link/wp-content/uploads/2024/05/11-creative-ways-to-earn-links.svg)


